“Together we have a stronger voice.”
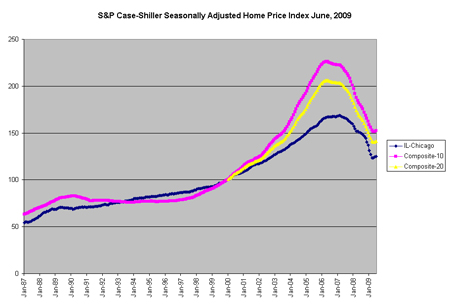
S&P/Case-Shiller Home Price Index - Seasonally Adjusted - June 2009
The data for this chart is in the attached MS Excel 2003 Spreadsheet. The on-line source is the Standard and Poors website. While the index shows a drop of over 25% from 2006, prices seem to be headed up again in the Chicago metro area.
| Attachment | Size |
|---|---|
| 132 KB |
Gallery:
Image:
- Log in to post comments