Harris Sweep of Evanston Led by North Side and Lakefront
A couple weeks after the election, the Cook County Clerk finally released ward- and precinct-level results for the suburbs. These returns show the strongest support for Democratic candidates in north Evanston and along the lakefront, and few significant differences in partisanship anywhere.

This may surprise some. For decades, some in Evanston have perpetuated negative stereotypes of north Evanston and southeast Evanston — essentially the 6th, 7th, and 3rd Wards, minus the student population of the 7th. This narrative serves to otherize the residents of those areas and to discount the facts and concerns that their residents, 1/3 of Evanston, bring to the City’s attention. Key to this marginalization has been the trope that those wards’ middle-class residents, and especially those who have fought strongly for preservation of the charm that makes Evanston unique, are some sort of conservative bastion, obstructing the liberal virtue of “real” Evanston.
Putting aside the conflation of partisanship with righteousness, this parochial cliché has been untrue for decades, and the newest election numbers should bury it. The largely liberal politics of Evanston are broadly distributed citywide. A Republican base of about 10% endures, but there are no so-called conservative wards. If anything, Trump may have more appeal outside the 6th, 7th, and 3rd wards.
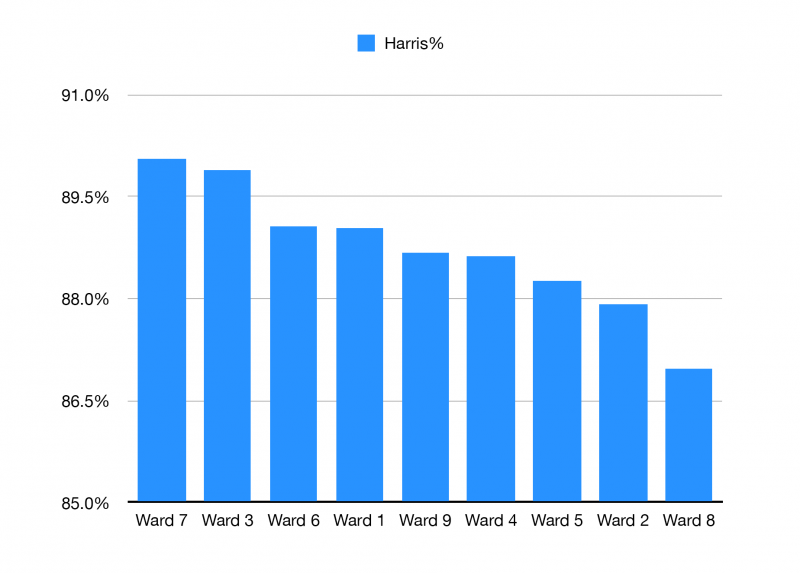
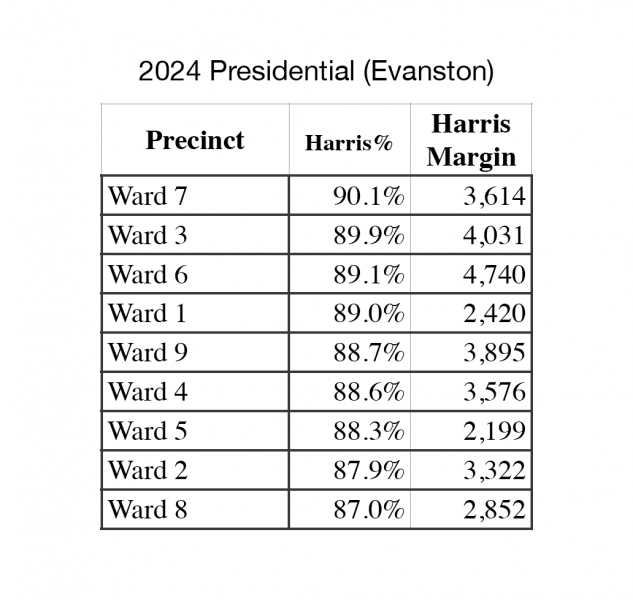
While the Harris-Walz ticket piled up landslide majorities throughout Evanston, carrying every single precinct, only one ward topped 90% for the Democrats: the 7th. The 4th precinct of the 7th, tucked in east of McDaniel and south of Grant, had the highest vote % for Harris-Walz in Evanston, a tsunami-like 93.1%.
Close behind the 7th Ward were the 3rd Ward, at 89.9% Harris to 7.3% Trump, and the 6th at 89.1% to 8.1%, an 11:1 clobbering. The percentages total less than 100% because of votes for RFK Jr. or for no candidate.
While all wards were also within landslide range, the bottom three performers for Harris, percentage-wise, were the 8th, 5th, and 2nd Wards. The 8th Ward, bordering Chicago on Howard St., was the only ward where a majority of precincts produced double digits for Trump-Vance.
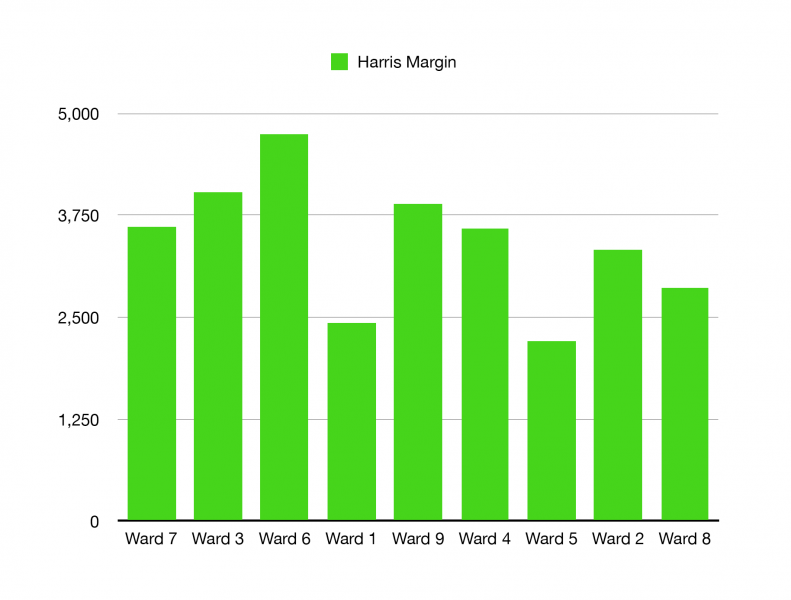
The 6th, 7th, and 3rd wards, in addition to delivering the highest percentages for Harris, were also the three top wards in turnout. Average turnout in northwest Evanston was over 84%. That translated into big pluralities for the Democratic ticket. The 6th Ward alone padded Harris’s Illinois margin by a whopping 4,740 votes; the 3rd Ward was second at just over 4,000.
By contrast, the 5th Ward, apparently the least inspired by Harris’s candidacy, with less than a 63% turnout, delivered a bump of only 2,199 votes. The triangular 3rd Precinct of the 5th, south of McCormick Blvd and west of Green Bay, had the worst turnout in the city, with less than 54% of registered voters casting votes in what had been billed as an historic election.
A statistical check on these numbers is to look at some down-ballot races, typically better indicators of party affiliation, where personality of candidates is not so prominent. Races for state’s attorney, circuit court clerk, and water reclamation district confirm the pattern of general blueness Evanstonwide. Those three races all clocked in at around 86%-88% Democratic, with little variation between wards. However, the Democratic percentage in county races was somewhat lower than for Harris. Multiple factors, impossible to discern from precinct-level data, might explain this: Republicans “crossing over” only for president; purposeful downballot ticket-splitting; general less-positive feeling about the Illinois/Cook County Democratic Party brand.
Protest might also be a factor in both lower turnout and the surprising number of non-votes reported. In the presidential race, 896 Evanston voters, roughly 2.4% of those who cast a ballot, managed not to vote at all in the presidential race, and another 265 voted for a withdrawn candidate. One wonders, what motivates a voter to make it all the way to the polling place, or mail in a ballot, yet leave the top contest blank? That so many ballots could be “spoiled” seems unlikely. So — dislike of both major candidates? Making a statement of pointlessness? Silence unfortunately says little, leaving only surmise, including, perhaps, a need for review of the vote-counting mechanism, since 2.4% could make the difference in many races.
Down-ballot, the vote falloff, as is typical, was even greater. Over 6% of voters who cast a ballot did not vote at all in the MWRD race, for example, despite seven candidates to choose from.
If voters don’t feel informed on downballot races, perhaps some don’t want to guess, or may feel more empowered to cast protest votes. In the student-heavy 3rd precinct of the 7th Ward, for example, more voters left county races blank than in any other precinct, with nearly 1/3 of all voters for MWRD casting none. In that campus precinct, votes for third party candidates (Libertarian, Green Party) were also twice as high as elsewhere in Evanston.
Precinct-level data (see .pdf at end of this post) has limits to what it can reveal, but without in-depth exit polling, it’s one of the best sources of fact. Fact, in turn, is a far better basis for policy than is stereotype.

| Attachment | Size |
|---|---|
| 255.36 KB |
- Log in to post comments
