“Together we have a stronger voice.”
Is Evanston Growing or Shrinking?
“In 2023, about 77,800 residents lived in Evanston, which is nearly 5% more than the population in 2000 … [and a] growth rate of 0.35% annually [from 2010 to 2023], with a projected population of about 84,175 by 2045.”
City of Evanston, “Envision Evanston 2045” (Nov. 2024 draft), at 16
“Evanston’s total population decreased slightly between 2000 and 2020 (-2%) and the number of households decreased by 5%.”
City of Evanston, “Draft FY 2025-2029 Consolidated Plan and 2025 Action Plan” (Nov. 2024) at 81
Is Evanston growing so fast that it needs to build a lot more buildings to accommodate a projected additional 7,600 residents in the next 20 years,1 growth of more than 10%? This was a core tenet of the Envision Evanston 2045 process and the upzoning agenda that's been driving it for over a year, even before its launch. But for several reasons, this assumption was always so broken that just by itself it warranted a reset of the entire planning process. The good news?
The new second draft of the comprehensive plan no longer relies on this sole projection. It actually quietly omits any growth trend discussion, past or future, whatsoever. The bad news is that the City apparently has no real idea whether it is shrinking or growing, yet still is pushing more density. The way to resolve this is to acknowledge that growth is a policy choice.
The first obvious flaw in assuming growth is that it’s circular reasoning. An extra 8,400 people aren’t going to parachute into Evanston and mill around if there isn’t sufficient housing available. People aren’t stupid. Winter here is cold. Various Evanston policies or programs may attract an above-average suburban share of some who are in need, but it’s not cheap to live here. That’s unlikely to change in a suburb with a lakefront, two rail lines, and a major research university. Since we know family size is decreasing, only a flood of construction on an order of magnitude unseen in Evanston since the 1940s would spawn population growth of 8,000+. Those projections never made sense -- unless someone’s trying to make those numbers happen.
The second flaw is that the forecast of 8,400 impending arrivals relied on a single source, an unexplained, unreviewable estimate attributed to a regional agency, CMAP, that must have extrapolated a trend line from some past date through the the 2020 census. But the 2020 count of nearly 79,000, taken during the pandemic, sticks out as a problematic statistical outlier. All other census estimates for Evanston from 2015 through 2024 are lower, within the 75,000-77,500 range, and rapidly recede after 2020. See Fig. 1 below. No explanations for what allegedly drove the odd 2020 figure were ever discussed.

Fig. 1. Evanston Population 1860-2024 (by decade, plus 2005, 2015, and 2019-2024)
Also disconcerting: at the same time the City was telling residents via Envision Evanston 2045 this winter that we had great growth from 2000-2020, it was telling the federal government the opposite. This is the third major flaw in the assumption of growth. The City, in its most recent (2024-2029) draft report to HUD, the comment period for which quietly came and went during the furor over the first Envision release, stated, “Evanston’s total population decreased slightly between 2000 and 2020 (-2%) and the number of households decreased by 5%.”2
Putting aside the self-contradiction, is a decreasing population accurate? Is it even possible? The figure for HUD concededly aligns with more recent estimates that contradict the 2020 census number. Flaw #4 in the growth premise is that multiple estimates, like the City’s itself, say that Evanston is shrinking. Evanston, in the most recent Census Bureau estimate of population changes from 2020 to 2023 in places of 20,000 or more people in the US, was far towards the bottom, in negative growth territory, estimating a loss of over 3,000 in population, a decline of 3.9%. No Cook County city or village grew during this period.3
Demographic websites echo that Census Bureau estimate of Evanston population loss. Neilsberg Research states that in 2023, “the population of Evanston was 75,070, a 0.40% decrease year-by-year from 2022,” which itself represented “a decline of 1.59% compared to a population of 76,586 in 2021.”4 Digging deeper, the firm concludes, “Over the last 20 plus years, between 2000 and 2023, population of Evanston increased by 904. In this period, the peak population was 77,876 in the year 2009. The numbers suggest that the population has already reached its peak and is showing a trend of decline.”5
A smaller firm, estimating a 2024 Evanston population of 74,155 based on census numbers, and projecting a population of under 70,000 by 2030, came to the same conclusion, stating “Evanston is currently declining at a rate of -1.22% annually and its population has decreased by -4.7% since the most recent census.”6
Leveling off or even decline is not a new phenomenon. In the decade from 1950-1960, Evanston experienced a net population increase of over 5,600, but that was entirely due to the explosion in births during the Baby Boom’s peak, resulting in a huge surplus of births over deaths, or what demographers call “natural” increase of population. Against that natural increase, Evanston in the 1950s actually experienced a net out-migration of over 2,200 residents, but the internal demographics change more than canceled that out.7
As a result, according to Evanston’s consultants who prepared a 2006 review of downtown, “Evanston’s population peaked in 1970 at 80,113 with 2.71 persons per household. Then it decreased to 73,706 in 1980 with 2.35 persons per household and 73,233 in 1990 with 2.31 persons per household.”8
If Evanston is losing population, it has plenty of company, locally. While downstate Illinois since 2010 has been the prime contributor to Illinois losing residents, Chicago metropolitan population is “essentially stagnant,”9 or even declining slightly,10 and even that overall metropolitan “stability” is somewhat misleading, because there's been significant growth southwest of Chicago, which offsets and masks decline in Chicago proper and most suburbs.
The larger context is Illinois’s population loss. CMAP says, “Illinois lost nearly 80,000 residents in 2020, marking the seventh straight year of population decline, according to new estimates from the U.S. Census Bureau.”11 During the 2020-2023 period, Illinois experienced an estimated population loss of approximately 2.1% on the heels of a decade in which Illinois lost a previous 2% of its population.12 See Figure 2.
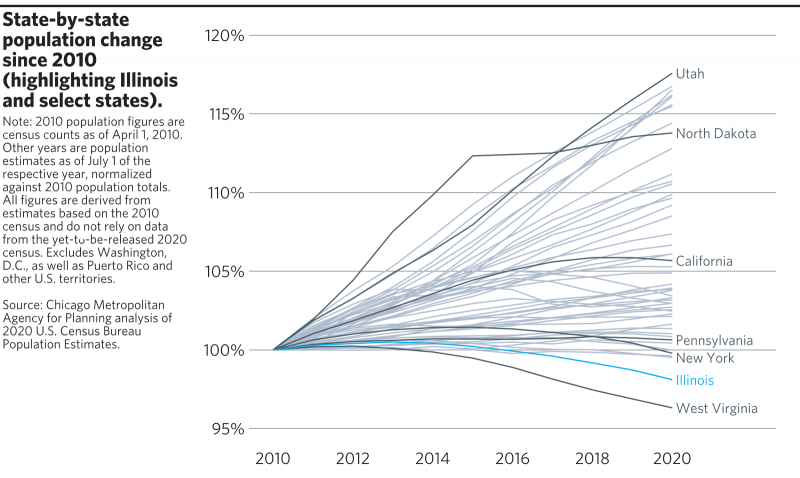
Fig. 2
Illinois’s 2020-2023 population loss placed it at #49 in the nation for population growth. Only California is currently hemorrhaging residents faster.13 That is a recent development. During the 2010-2020 decade, economically troubled West Virginia had the greatest exodus; however, during the Covid-19 pandemic, in which most waves of infection and the most severe lockdowns occurred in large cities, California and Illinois both overtook West Virginia.
So what is the reality? Is Evanston growing or shrinking? How can the various estimates be reconciled with the 2020 census, or with each other?
Part of the answer is to look at the data sourcing. The 2020 number is an actual census count, whereas figures for years on both sides of 2020 are estimates, either a one-year snapshot or an average of five years. Such estimates are by the “American Community Survey” program of the Census Bureau that extrapolates from samples, not full counts. These samplings have a margin of error and may be high or low by several percent. As anyone who’s gone door-to-door for Girl Scout cookies or political candidates knows, it can be hard to get into multi-unit buildings or group living situations. After the 2020 census, analysis did show a fraction of folks missed in Illinois, mainly in group living housing, though not enough to change the overall downwards trend.
The 2020 census also took place during the pandemic and social disorder. That produced distortions. College students interrupted schooling. Many families and young workers relocated temporarily, especially if lockdowns cost someone their job. Homeowners who might otherwise have been considering selling stayed put because of societal and market uncertainty. Locally, with Chicago schools on extended lockdown and even parks under closure and social distancing orders, and in the wake of rioting in the city, there was a bulge in migration to suburbs, especially among younger couples with children, looking for at least a yard their kids could play in. All this contributed to at least a temporary surge in demand for Evanston housing, and may have exaggerated permanent numbers.
However, consider that since 1996, at least 5,600 units of new housing, most of it multi-unit, has been built in Evanston. Even after accounting for demolition, that construction almost certainly produced a net increase of at least 5,000 units, ranging from dorm rooms and independent senior living to (mainly) lots of apartments and condos, plus a few single-family homes. It would be very unusual for a community to add 5,000 housing units and not see population increase.
On the other hand — and at the risk of running out of hands — it depends on what is happening in Evanston's 35,000 houses, condos, apartments, and other housing. One factor is aging. Everyone seems to agree that over the past 20 years Evanston has aged, a function of the fact that the median Baby Boom householder is now about 68. So the normal demand for single-family houses competes with additional unusual “demand” to stay by those who already raised families there. Baby Boomers aren’t doing anything different than previous generations, the cohort is just bigger. The impact of that on population is to produce a deceptive temporary decrease. For example, my house and the two houses directly west of us, that 25 years ago had 13 total adults and children, now house only 5 older adults, filling up only when children and grandchildren come to visit. Empty nests are hardly a new phenomenon, but multiply this a few thousand times across Evanston and it adds up to a downward force on population.
Another factor is the growth of Northwestern over the past three decades. NU has added several thousand undergraduates and grad students to its Evanston campus. Many live either in singles or doubles on campus or in studios or 1BR or 2BR apartments off-campus. Few have children. I count only 530 units built on campus since 1996, and at least one of those projects replaced fraternities that formerly could house about 100. So even though not all off-campus students live in Evanston, the added student population has to go somewhere, and many must be occupying a large proportion of all the new units built in the city during the same timeframe.
A growing body of students wouldn’t account for a loss in Evanston population but would account in large part for why population hasn’t grown as much as new construction might predict. What would account for “population loss” would be if census surveys took place when students were on break, or if algorithms used voter registrations that undercount NU students who remain registered back home.
So what does all this mean? Since the City avoids the question in its new plan draft, I’ll take a shot. The 2020 census was probably fairly accurate, although possibly bumped up slightly by pandemic factors. The corroborating data is the 5,000+ units built in the last 30 years, assuming most have been filled, even if by solo occupants. The departure of the children of an aging cohort, along with some mortality, has produced some offsetting decline; the lower schools enrollment corroborates this, although school enrollment is itself complex. But, net, Evanston probably has grown a little since 2000 and is probably closer to 76,000 or even 77,000 than to 74,000. But does that mean we need to go on a building binge to “accommodate” (or stimulate) future growth along a trend line going back to 2000? Absolutely not.
Why is that? First, because of the aging. Let’s go back to my block. Literally every house sold in the past five years by empty-nesters was filled by a young family with children. We now have more kids on our block than in years, and more will be coming. Moreover, not only were most of these already 3BR+ homes, but many longtime owners also added on a bedroom or two over the past decades. So the houses, condos, and apartments of older Evanstonians represent lots of capacity. The thousands of empty-nester Boomers who are going to vacate Evanston housing over the coming years -- and it's already happening -- are going to open up housing for, on average, 2x or more that many younger residents — without a single additional unit needing to be built. And like everything Boomer, that will happen en masse. It’s just a function of demographics.
But the overarching reason why we don’t need to build thousands of more units above and beyond that goes back to the first flaw in the growth assumption: putting aside cyclical generational fluctuations, growth in a mature, fully-developed suburb is a choice, not an inevitability, let alone an imperative. The discussion that Evanston leadership has avoided like the plague for decades, because it is addicted to building permit fees and an ever-increasing “tax base,” is this: how big do we actually want to be? What is the best size for Evanston?
For the past 50-60 years, Evanston population has fluctuated within a pretty stable range of 70,000-80,000. That's a good indicator that that’s the natural optimal maximum for this city of less than 8 square miles of land. If the question were put to the residents, most would agree that they don’t want to be more crowded. I've never met a single resident who said "I'd like it to be more difficult to find a parking space or get a dinner reservation, longer lines at the bank and grocery would be fun, and I'd really like more crowded classrooms." If we believe in concepts like self-determination, choice, and democracy, then asking residents is the way we ought to approach the questions of population, growth, and density, rather than lecturing residents that they have no option but to sacrifice the look and feel of Evanston, neighborhood character, privacy, airspace, sunlight, and existing quality of life to satisfy unsupported top-down declarations or squishy numbers.
Updated 7-21-2025 to reflect new, different figures included in the Feb. 2025 and June 2025 drafts.
References
1 City of Evanston, “Envision Evanston 2045” (Nov. 2024 draft), at 16. Note that whereas the November draft used a 2023 figure of 77,800, the Feb. 2025 draft and June 2025 draft use a figure of 76,552, over 1,200 less. "Envision Evanston 2045" (Feb. 21, 2025), at 144; "Envision Evanston 2045" (June 6, 2025), at 161.
2 City of Evanston, “Draft FY 2025-2029 Consolidated Plan and 2025 Action Plan” (Nov. 2024), at 81
3 U.S. Census Bureau, “Cumulative Estimates of Resident Population Change for Incorporated Places of 20,000 or More in 2020, Ranked by Percent Change: April 1, 2020 to July 1, 2023,” https://www2.census.gov/programs-surveys/popest/tables/2020-2023/cities/.... Of course, if 2020 was too high, that would explain a "decrease" if subsequent counts were more accurate.
4 Neilsberg Research, “Evanston, IL Population by Year - 2024 Update | Neilsberg,” https://www.neilsberg.com/insights/evanston-il-population-by-year
5 Id.
6 “Evanston, Illinois Population 2024,” World Population Review, https://worldpopulationreview.com/us-cities/illinois/evanston
7 E. Kitagawa & K. Taeuber, eds., Local Community Fact Book | Chicago Metropolitan Area | 1960 (U. of Chicago 1963), at 322 (TABLE VI-2. COMPONENTS OF POPULATION CHANGE, 1950-60: CITIES OF 25,000 OR MORE POPULATION IN CHICAGO, ILLINOIS-NORTHWESTERN INDIANA STANDARD CONSOLIDATED AREA)
8 Robert B. Teska, “Downtown Evanston Revitalized: 1956-2006,” at 50
9 CMAP, “Illinois sees second-largest population loss of U.S. states,” CMAP (Jan. 20, 2021), https://cmap.illinois.gov/news-updates/illinois-sees-second-largest-popu...
10 CMAP, https://cmap.illinois.gov/news_topic/demographics/ (“The Chicago region is experiencing demographic shifts that have led to recent small population declines, which hold significant implications for the future.”)
11 Id.
12 CMAP, supra n.7
13 U.S. Census Bureau, “Annual and Cumulative Estimates of Resident Population Change for the United States, Regions, States, District of Columbia, and Puerto Rico and Region and State Rankings: April 1, 2020 to July 1, 2023,” https://www2.census.gov/programs-surveys/popest/tables/2020-2023/state/t...
- Printer-friendly version
- Log in to post comments